So just which cities are busiest when it comes to planning applications and purchasing planning maps? Which places are developing their businesses and houses and adding on extensions or undertaking major changes in this tough housing market?
Not necessarily the cities you would think of. For example, Norwich, despite being 36th largest in population terms is 3rd largest in terms of planning map purchases. Random additional fact: its population is also the largest user of eBay per head...perhaps the money made from the one is paying for the other! Check the map below for the full results.
Download your Ordnance Survey map here
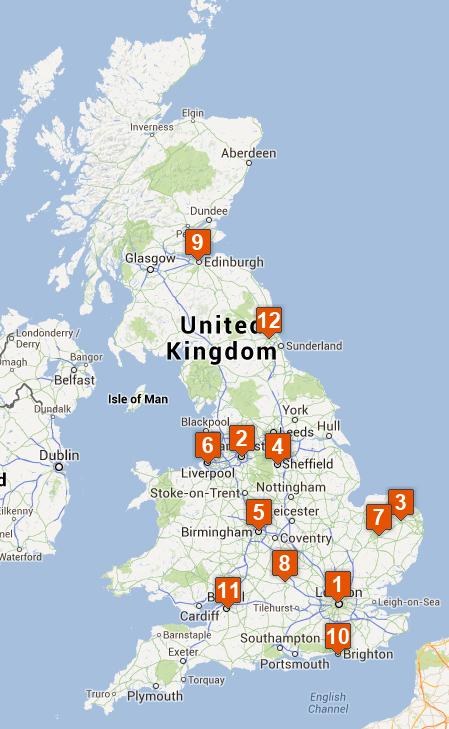
- London
- Manchester
- Norwich
- Sheffield
- Birmingham
- Liverpool
- Cambridge
- Oxford
- Edinburgh
- Brighton
- Bristol
- Newcastle upon Tyne
and the rest...
- Leeds
- Leicester
- Bath
- Guildford
- Milton Keynes
- Northampton
- Reading
- Worcester
- Aberdeen
- Wrexham
- Cheltenham
- Derby
- Exeter
- Nottingham
- York
- Cardiff
- Swansea
- Bournemouth
- Chester
- Croydon
- Maidenhead
- Plymouth
- Wolverhampton
- Glasgow
- Chelmsford
- Southampton
- Teddington
- Watford
- Basingstoke
- Doncaster
- Gloucester
- Luton
- Solihull
- Stockport
- Belfast
- Aylesbury